Mapping electric vehicle charging infrastructure in Greater London
Introduction
In April 2025, the Department for Transport (DfT) released its latest statistics on the UK’s public electric vehicle (EV) charging infrastructure, which continued to show an upward trend in publicly installed devices, reflecting increasing consumer trust in EVs and the ongoing transition from petrol- and diesel-powered vehicles.
As of April 2025, there were 76,507 public EV charging devices installed across the UK, representing a 4% increase since January 2025 and a 28% rise compared to April 2024.
My blog last year set out that while expanding the number of public EV charging devices is important to encouraging EV adoption, the location in which these devices are installed is also crucial. My previous analysis examined the distribution of public EV devices across the UK, highlighting the need for Government to prioritise more deprived locations so that areas are not left behind in the EV transition, and rural, low population density areas where private sector investment is less viable.
EVs are not a silver bullet for decarbonising our transport network and funding resources are finite, so public EV infrastructure should be focused where it is most needed and active travel and public transport prioritised.
The following sections revisit my previous analysis, to discern whether devices are being installed in optimal locations. Instead of covering the entire UK, however, this will focus on Greater London.
EV distribution analysis
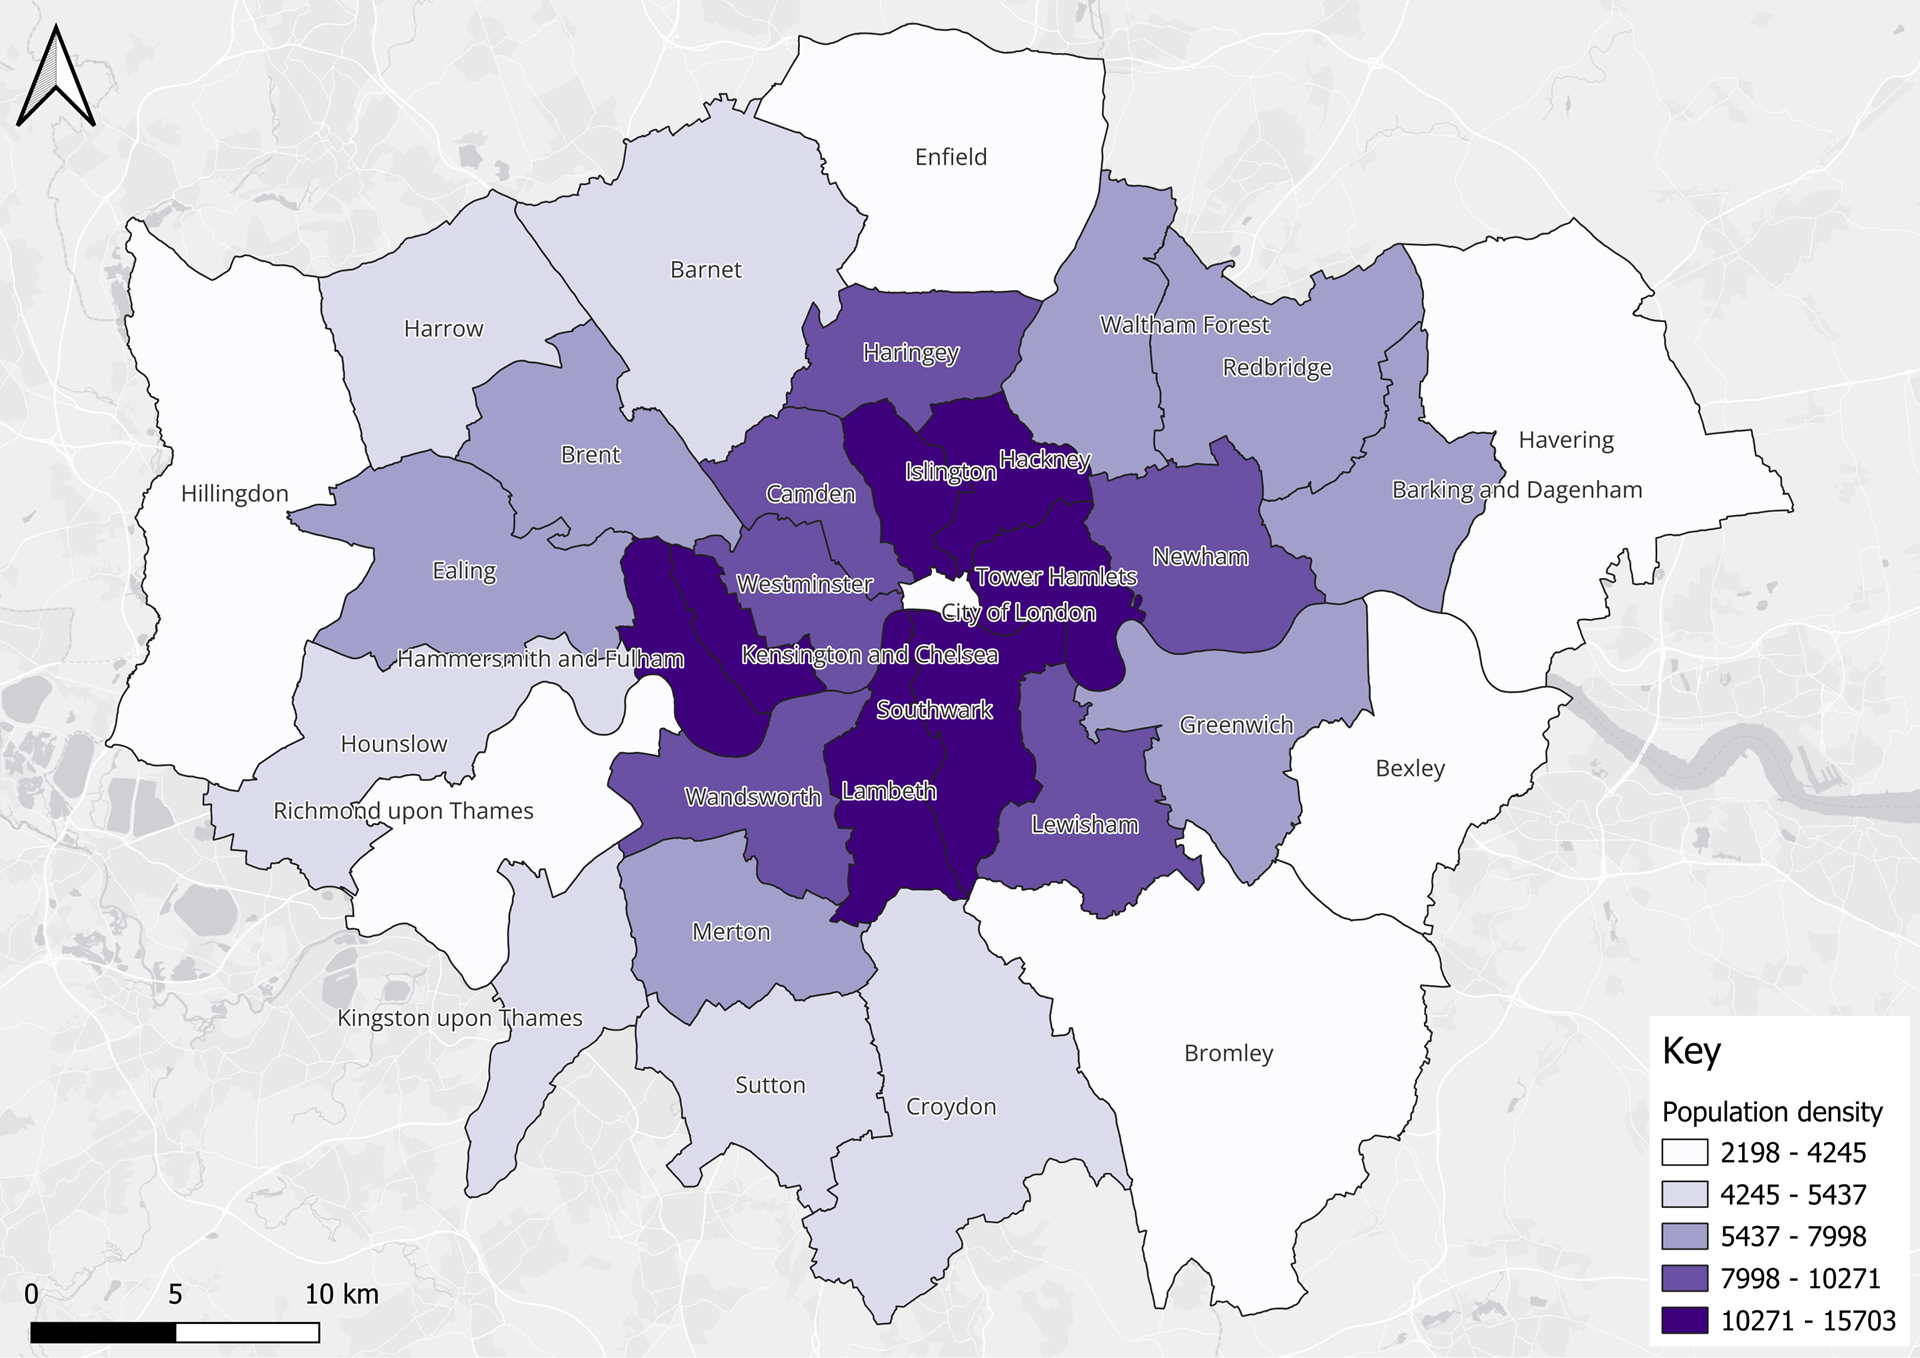
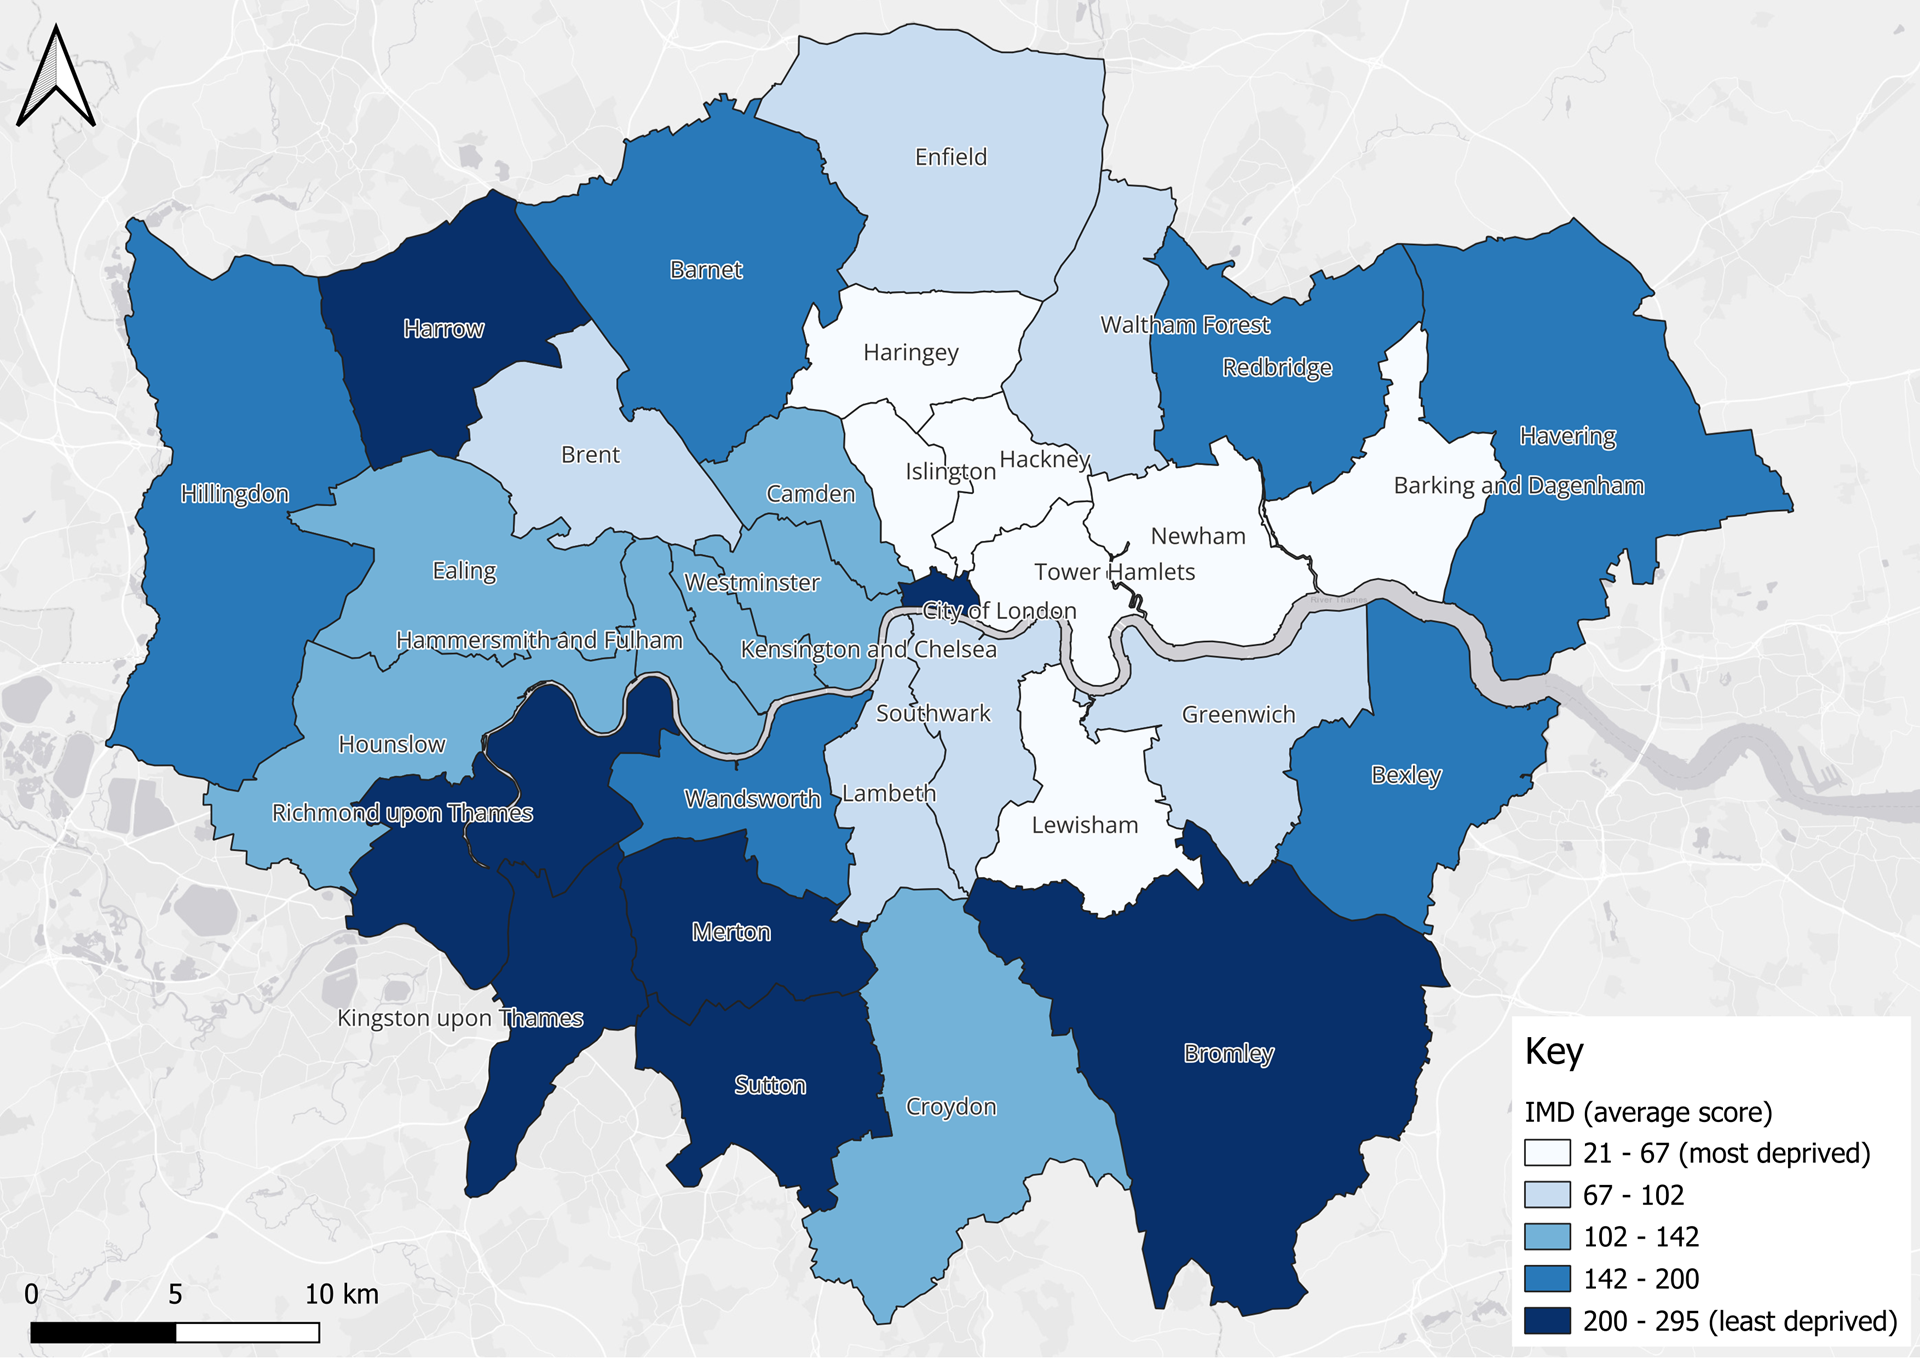
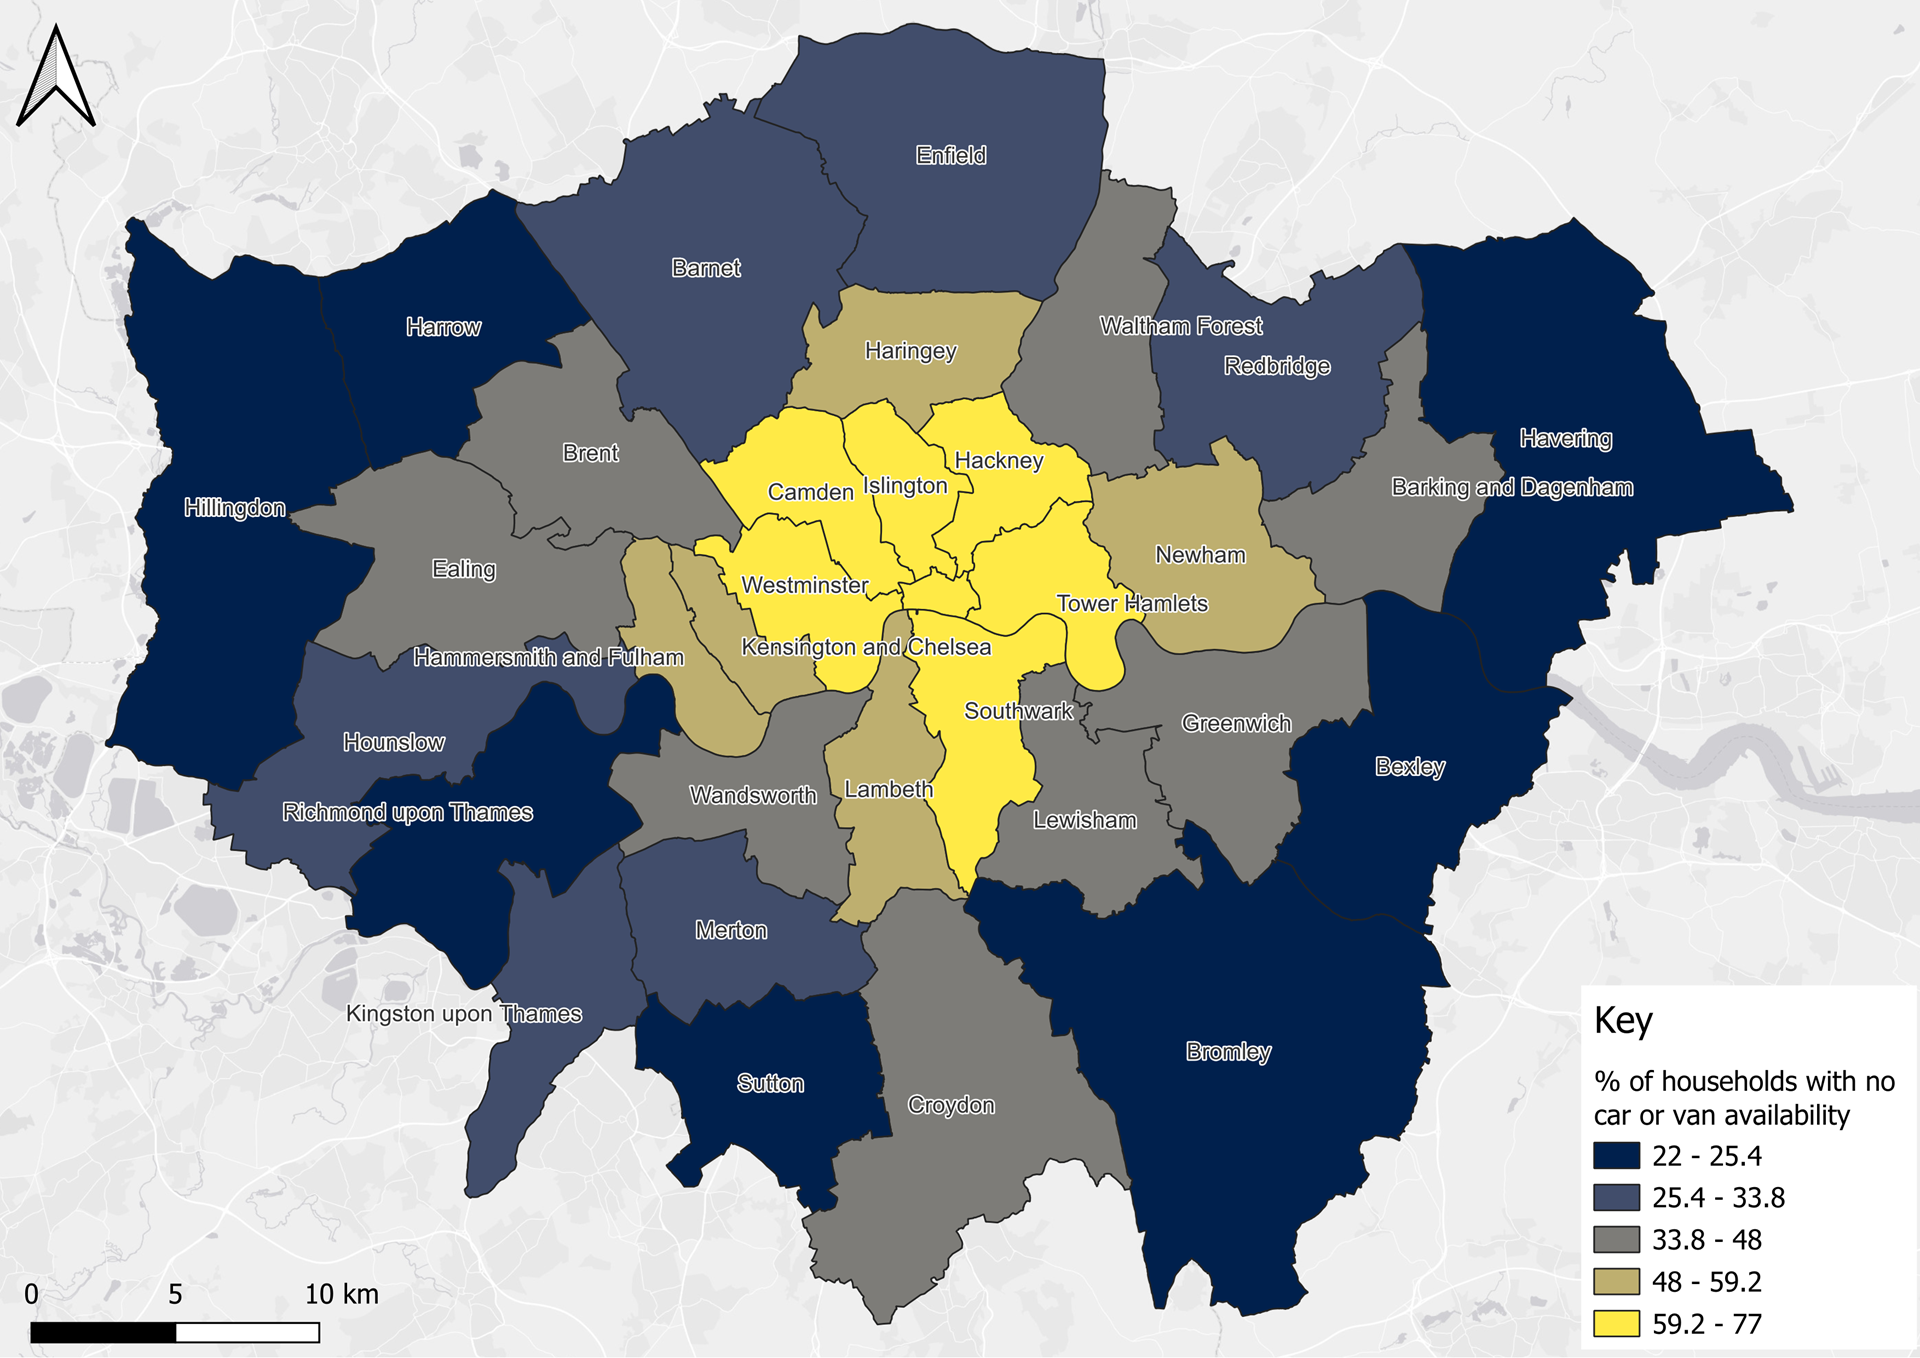
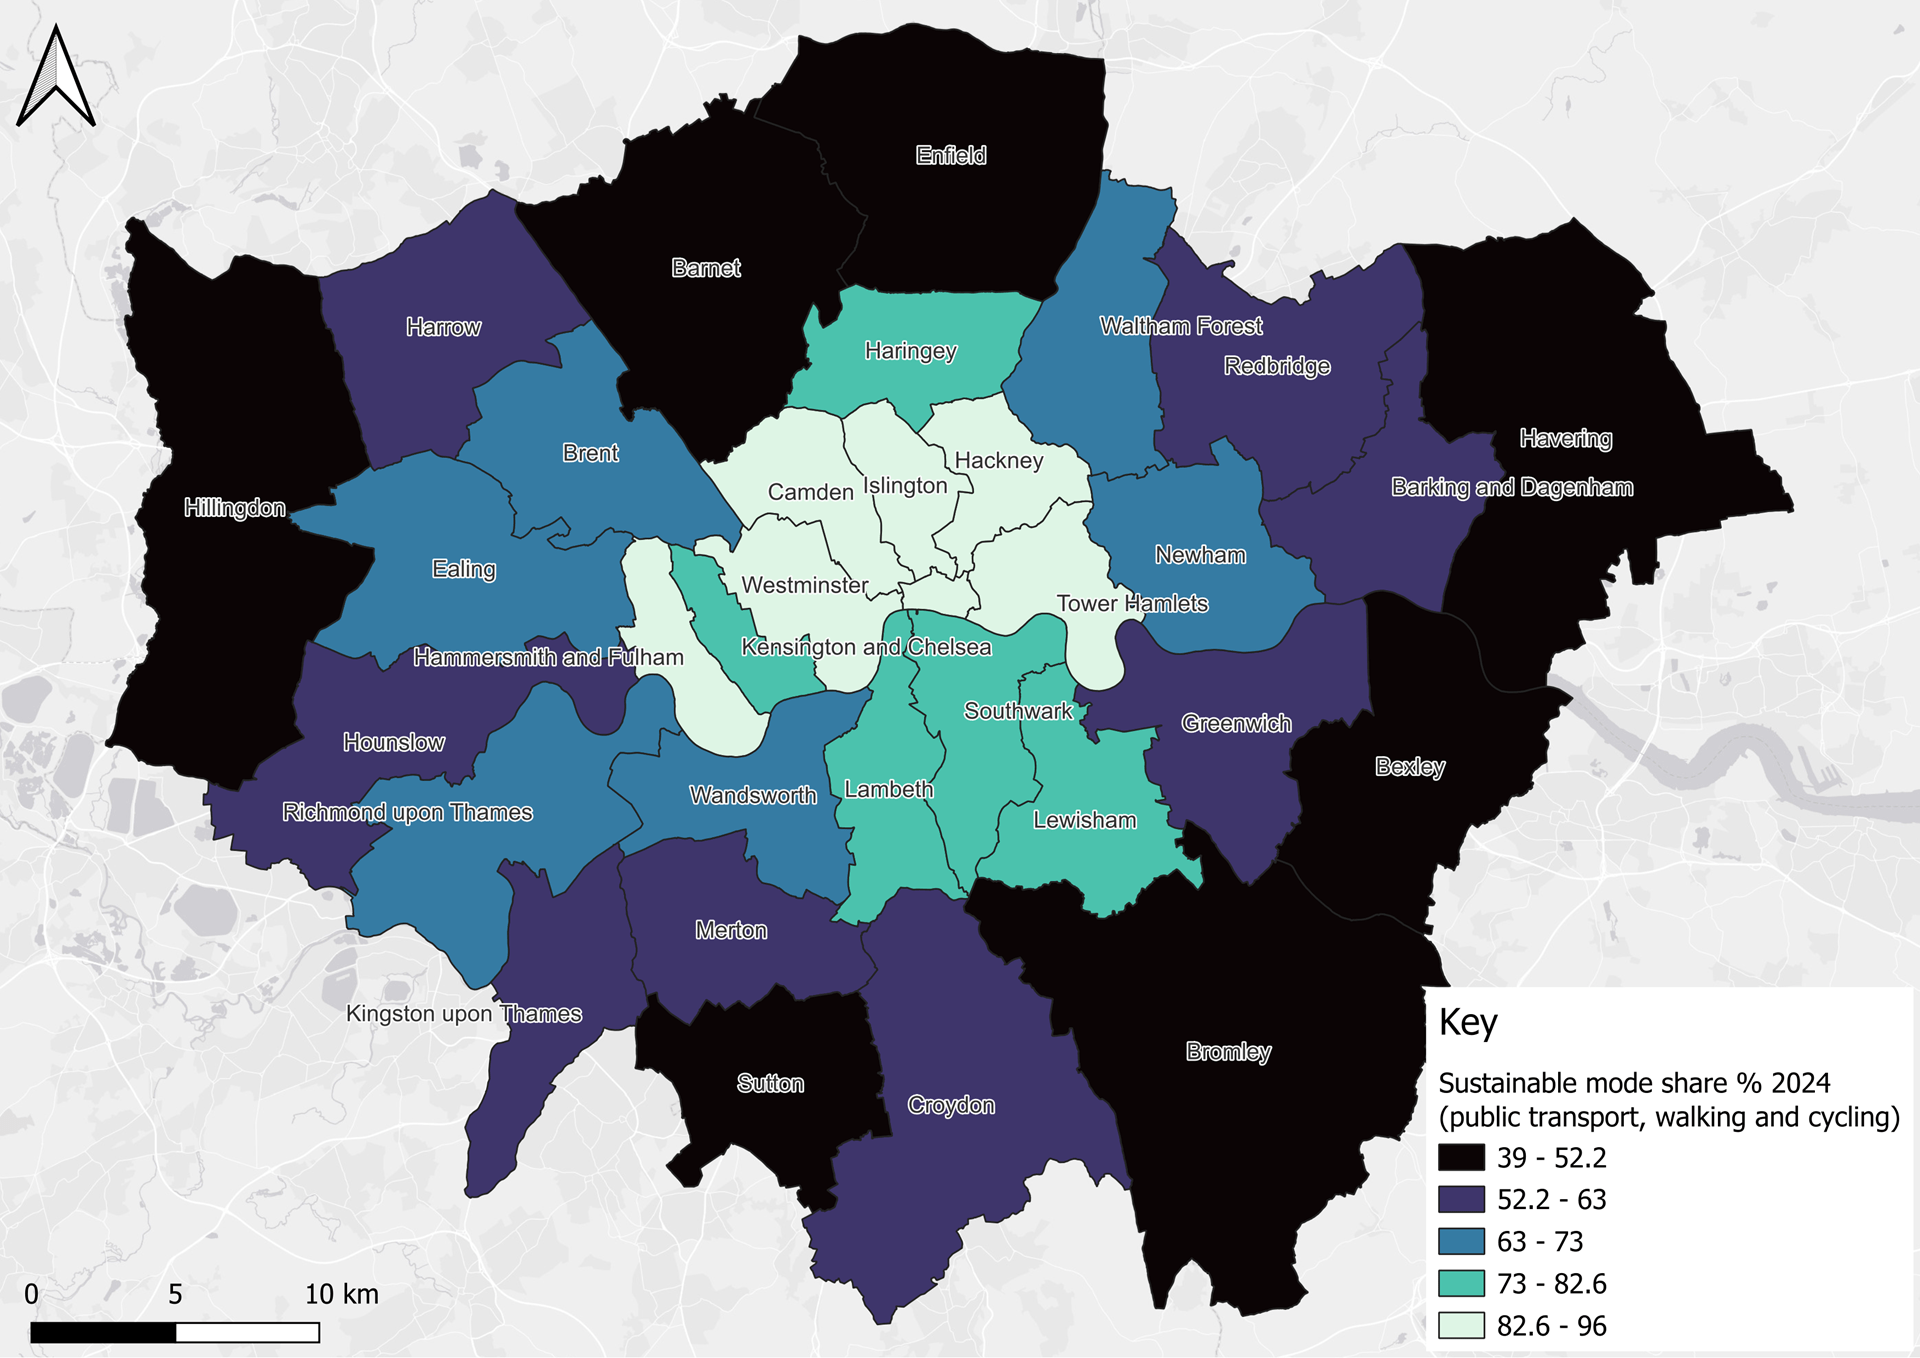
The four maps below show population density, the Indices of Multiple Deprivation (IMD), car/van availability across the London boroughs and sustainable mode share percentage. They demonstrate that population density is lower in the outer boroughs, particularly to the east in Havering, Bexley and Bromley. The outer boroughs to the south and north-west tend to be less deprived than in the centre, and more than 59% of households in inner London do not own / do not have access to a car or van. Unsurprisingly, more trips are made by active travel and public transport in the inner boroughs where higher population density and location of key destinations support the viability of public transport and active travel networks.
This suggests that public funding for charging infrastructure should be prioritised in the outer boroughs, particularly to the north, given its lower population density, which is less able to support high quality active travel and public transport infrastructure, and greater levels of deprivation relative to other outer boroughs. Whilst there is high deprivation in the inner boroughs, its location and demographics make it more suitable for active travel and public transport investment, and in addition the health and economic benefits of encouraging active modes over the private car, electric or not, are well established.
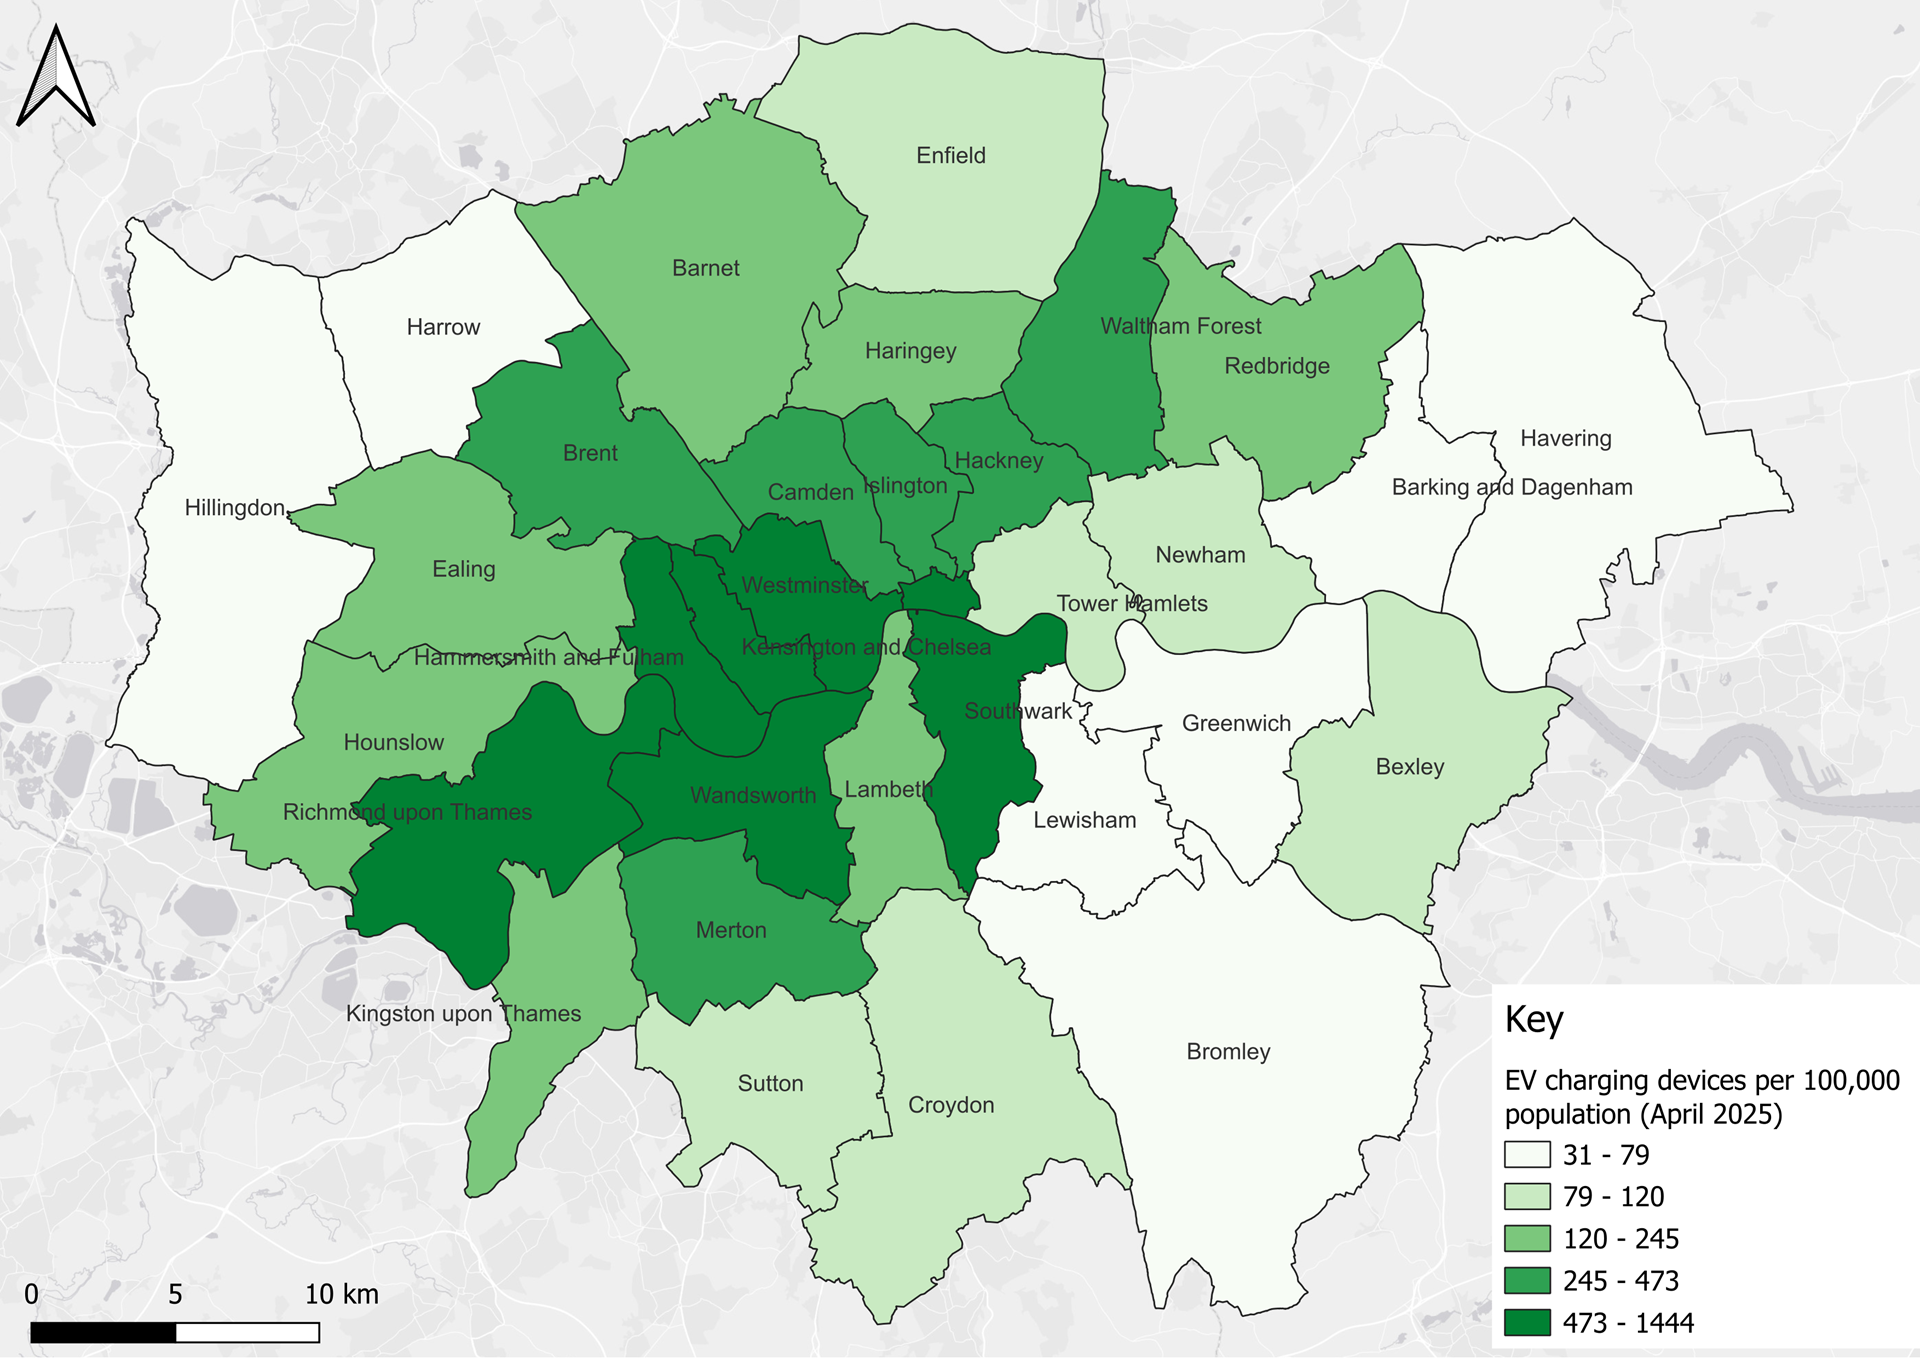
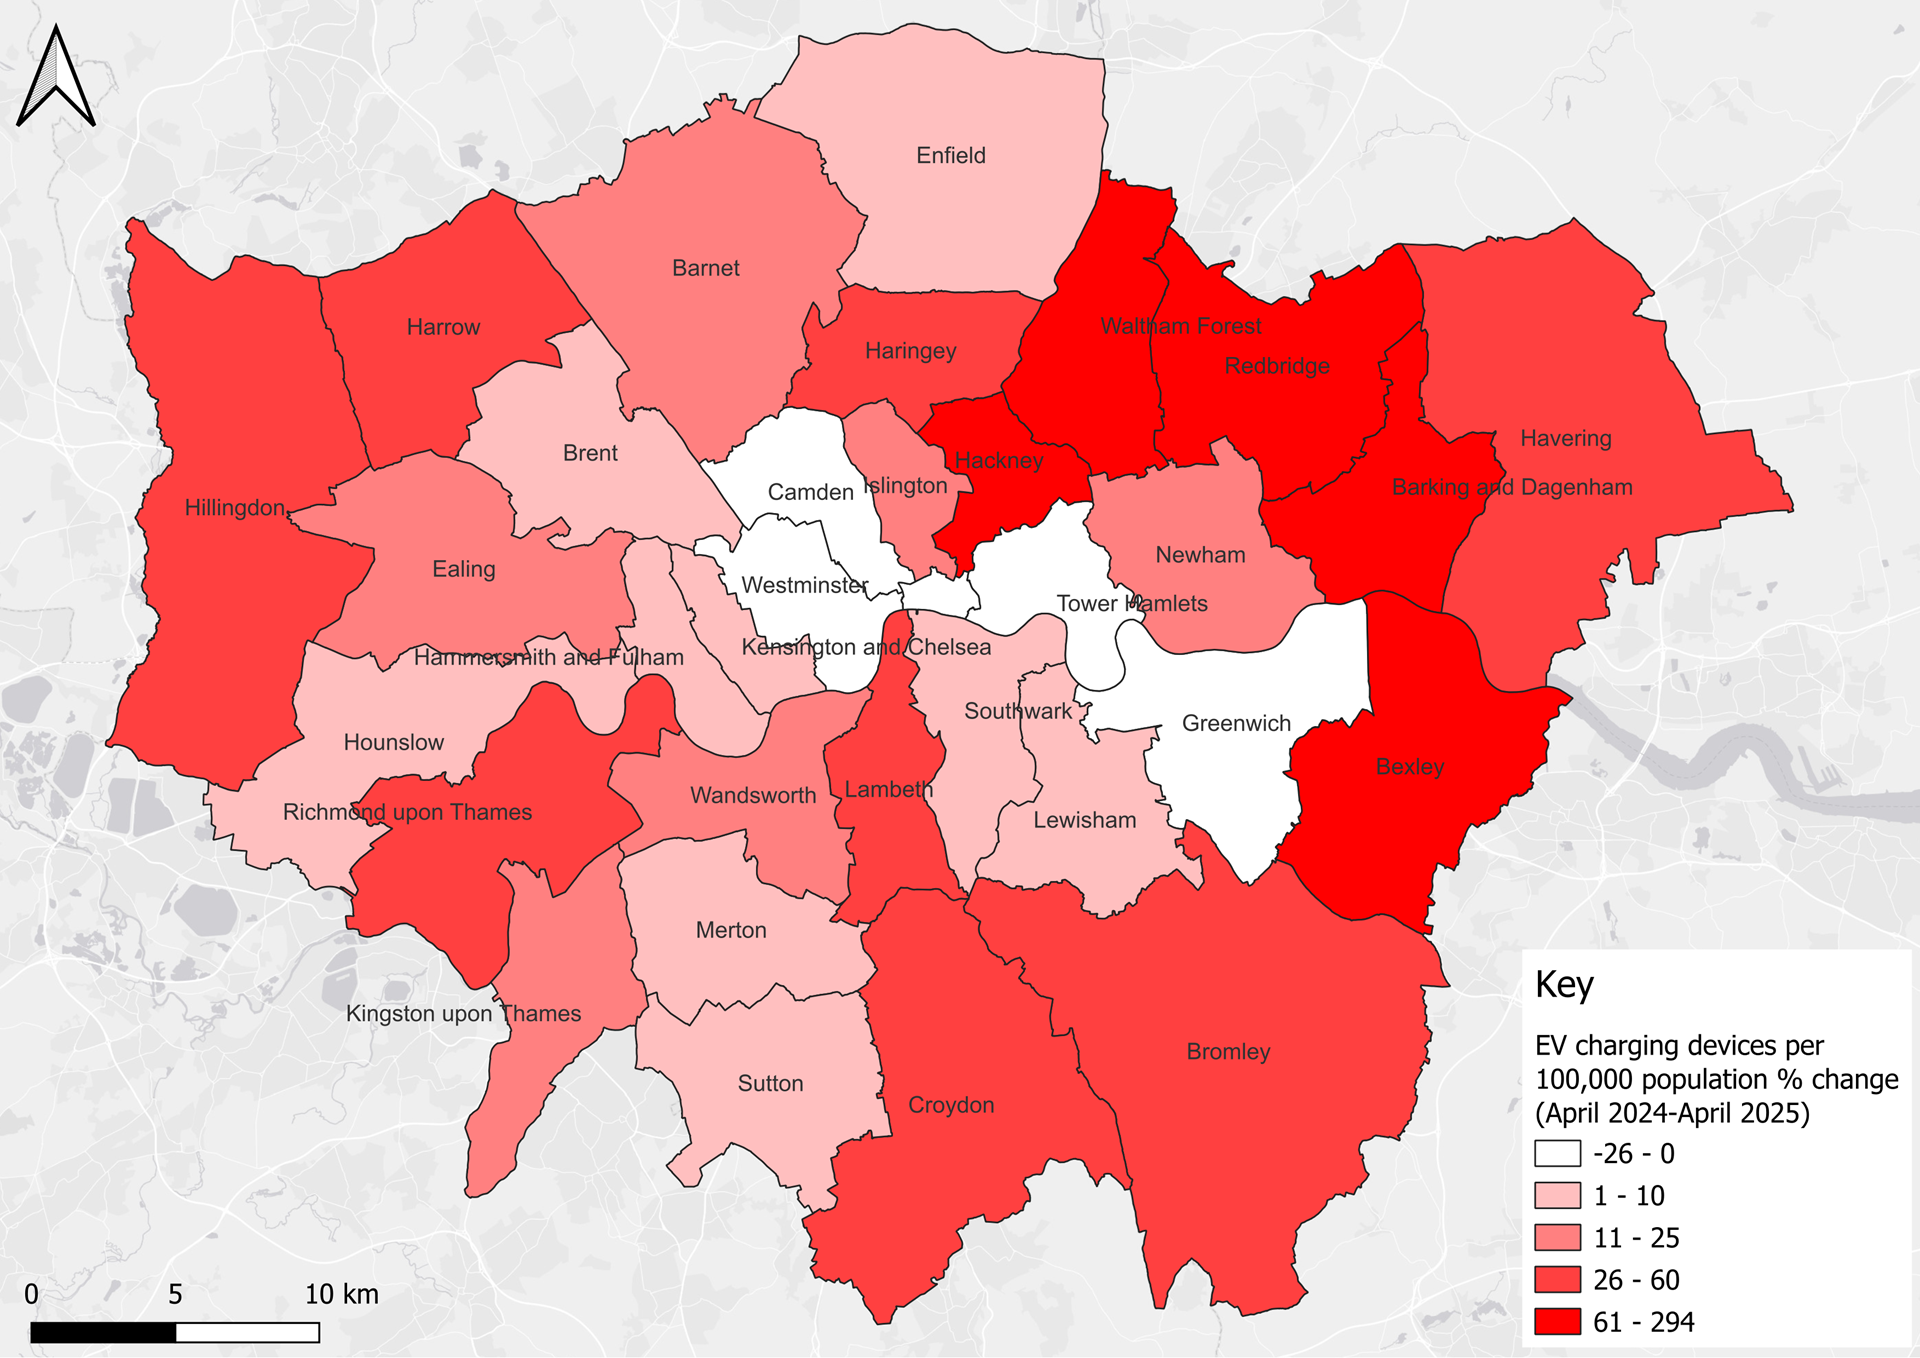
While this may partly reflect the lower baseline of EV devices in these boroughs, it indicates a positive trend, showing that infrastructure is accelerating in areas where reliance on private cars is likely to be higher and the private sector is less likely to invest EV charging.
Conclusion
This exercise sought to analyse the rollout of public EV charging infrastructure across London boroughs and compare this with economic and social factors, to indicate if charging infrastructure is being expanded in the most optimal locations, which encourages EV adoption whilst also prioritising non-motorised forms of travel.
Although higher densities of public EV devices are seen in inner boroughs, there are promising signs that faster expansion is occurring in the outer boroughs. It is recommended that with local authority support, Government should prioritise funding EV infrastructure in boroughs with lower population densities, higher deprivation and with geography that is more dependent on car use, whilst there should be a stronger focus on public transport and active travel investment in the inner boroughs.
Sustainable development
Discover our vision-led approach to planning new communities to embed sustainable commuting from the outset.

Our experts are happy to assist you
Experts team Sustainable development
